
Principles of Persistent Spectral Hole Burning
Figure 1. Single molecule embedded in a transparent solid. The region enclosed in the circle is called impurity center.
Figure 1a. An impurity center consists of one molecule and its closest surrounding
Homogeneous spectral line shape
Let us consider the absorption of light by one single molecule embedded in an optically transparent solid. An example of such solid could be a piece of plastic or polymer material, a chunk of a laser crystal or a piece of simple window glass. The relevant quantum-mechanical system consists of the electronic and vibrational degrees of freedom of the molecule and of the vibrational motion of the surrounding solid. Figure 1 shows a molecule surrounded by a solid. The molecule together with its closest neighbors (region inside red circle) is called impurity center. The absorption spectrum of one molecule is called homogeneous absorption spectrum or homogeneous line shape. Suppose that absorption occurs because of transition from the ground electronic state of the impurity center to it's excited electronic state. For organic dye molecules the ground electronic sate is singlet S0 and the excited electronic state is the lowest excited singlet S1. The absorption spectrum gives the probability of transition from the ground state to the excited state as a function of frequency n (or as a function of wavelength, l=c/n). Experimentally, the absorption spectrum is obtained by illuminating the crystal with a beam of light of frequency n, and by measuring the ratio, I(n)/I0(n), where I0(n) and I(n) is the intensity at the input and at the output of the crystal, respectively.
Figure 2. Variation of the homogeneous absorption spectrum with temperature
In the first approximation, the absorption spectrum has a sharp maximum, where the frequency n equals the energy difference between the states, divided by Planck's constant, n = (E(S1)-E(S0))/h. This is most true if the molecule is free in gas phase. In the solid, however, the transition probability depends also on the coordinates of the surrounding atoms. More precisely, the probability is a function of the density and of the frequency of the vibrational states of the solid. Crystal lattice vibrations, which propagate like waves are called phonons. Most critical is the presence of such phonons, which are part of the ground state wave function. Because the phonon state population varies largely with the temperature of the crystal, the whole absorption spectrum depends strongly on the temperature. Figure 2 shows how the homogeneous absorption spectrum of the molecule changes if the temperature is varied between room temperature (T=300 K ) and absolute zero temperature (T=0). At higher temperatures T=100 - 300 K the spectrum is tens to hundreds of cm-1 broad. It hardly contains any sharp structure. Since typical phonons in a solid matrix have an energy quanta of hnph ~10 - 1000 cm-1, the thermal motion at around room temperature ( kT~300 cm-1) has enough energy to excite a wealth of phonons. If many phonons are present, then each time the electronic transition occurs in the impurity center, it is impossible to predict what will be exactly the energy difference between the ground state and the excited state. Therefore the room temperature absorption spectrum appears to be broad and without sharp lines. It consists mostly of what is called phonon side band. At lower temperatures, however, the number of phonons is much reduced. Then there exists a real probability for electronic transitions where the phonons do not participate at all. Such transitions are called zero phonon transitions. Their important property is that they have a very well defined frequency. The corresponding spectral feature shows up as a narrow zero phonon line (ZPL). The narrowest and most intense zero phonon line is observed at absolute zero temperature. The width of the ZPL is then given by the inverse value of the excited state's lifetime. The phonon side band reduces at low temperatures to a relatively weak feature on the shorter wavelength side of the ZPL. In some special cases the zero phonon line can be detected already at liquid nitrogen temperature (T=77oK), however more typical is that the sample has to be first cooled to 10 - 20 K.
Figure 3a. Random fluctuations of the crystal structure cause random changes of the nearest environment of five chemically identical molecules;
Inhomogeneous line broadening
Now let's assume that the same piece of solid contains not just one, but many molecules, which all have the same chemical structure. Nevertheless, because no solid has a 100% perfect regular structure, different molecules are going to find themselves in slightly different surroundings. Figure 3a shows five chemically indistinguishable dye molecules in a randomly fluctuating environment. Figure 3b shows that this makes the ground and excited state energy to vary randomly from molecule to molecule, which causes the transition frequency to change randomly as well. The probability of finding the transition frequency in a unit frequency interval {n,n+dn} is given by inhomogeneous distribution function, g(n). The absorption profile, which results from the superposition of many homogeneous line shapes is called inhomogeneously broadened absorption band. Mathematically, the inhomogeneous absorption band can be described as a convolution of the inhomogeneous distribution function with the function describing the homogeneous line shape. Figure 4 shows the composition of the inhomogeneous absorption band at high (room) and at low (cryogenic) temperatures. At high
Figure 3b. The correspondence between the fluctuations of the energy levels and of the transition frequencies.
temperatures the inhomogeneous spectrum is a superposition of many broad phonon-induced bands. Usually the width of the phonon bands is on the same order as the width of the inhomogeneous distribution function. In this case the absorption spectrum of molecules within the inhomogeneous band can be hardly be distinguished from each other. Such absorption band has practically no spectral selectivity. At low temperatures each molecule has a sharp zero phonon line. This allows groups of molecules to be addressed selectively based on their ZPL frequency. We say that in this case the material has a high degree of spectral selectivity.
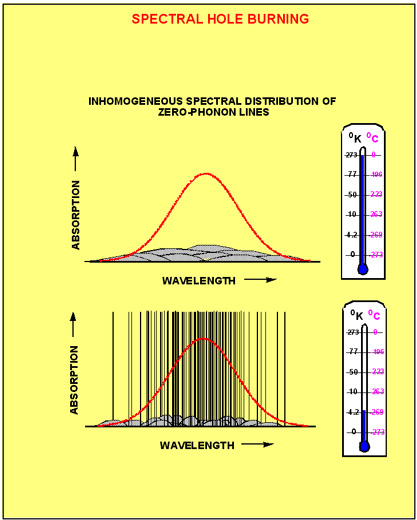
Figure 4. The composition of the inhomogeneously broadened absorption band at room temperature (upper picture) and cryogenic temperature (lower picture)
Spectral hole burning
In most cases, molecules and atoms always return from the excited state back to the initial ground state. There are situation, however, when this is not always the case. For example, some organic dye molecules can undergo a photochemical reaction, which alters the whole chemical structure of the molecule. If such photochemically active molecule absorbs light, then with a probability of a few % it will not return to the initial state called educt, but rather switches over to a new ground state called product. Often the homogeneous absorption spectrum of the product is much different from the educt, so that the corresponding inhomogeneous bands do not even overlap. Figure 5 shows one such example, where photochemical tautomerization at liquid helium temperature results in the shift of the S1 ← S0 absorption band from 634nm to 570nm. In fact, by illuminating the sample in the spectral interval around 634nm most of the molecules can be transferred from the educt to the product sate. If the illumination is terminated, then the initial absorption profile is not restored unless the sample is heated up to about liquid nitrogen temperature.
Figure 5. The mechanism of photochemical tautomerization. The molecule's absorption spectrum changes from educt (red) to photoproduct (green) as a result of illumination in the spectral interval 620 -640nm.
To illustrate this fact, Figure 5 shows the absorption profile taken before (red) and after (green) such illumination. Since at low temperatures the inhomogeneous absorption band of the educt consists of narrow zero phonon lines, it is possible to produce such photochemical transformations only in a small group of molecules, which are selected by their ZPL frequency. Selective bleaching of the inhomogeneously broadened absorption band consisting of narrow homogeneous absorption lines is called spectral hole burning (SHB). Besides the photochemical tautomerization reaction shown in Fig.5, there are many different mechanism for spectral hole burning in organic as well as in inorganic materials. In all cases the spectral hole burning relies on three basic factors: existence of narrow homogeneous zero phonon lines; existence of inhomogeneous broadening; existence of some kind of molecular of electronic mechanism, which alters the homogeneous absorption spectrum upon absorption of light.