Magnetic Susceptibility
![]()
Magnetic susceptibility can be used to find second order phase transitions of the
Ehrenfest variety in magnetic films. In our lab, we use magnetic susceptibility measurements
to locate the magnetic blocking temperature of superparamagnetic particles and quantify
the strength of the anisotropy energy barrier.
Protein encapsulated magnetic nanoparticles constitute isolated single domain magnets.
These tiny magnets typically have such small magneto-crystalline anisotropy energies
that at normal temperatures they cannot hold their magnetization. While the internal
magnetic ordering of these particles remains intact, the direction of the magnetization
vector will fluctuate thermally. Upon cooling the magnets, the magnetization vector
gradually becomes locked in a particular direction – or ‘blocked’ from thermally changing.
This change-over generally occurs when the thermal energy becomes comparable to the
anisotropy energy.
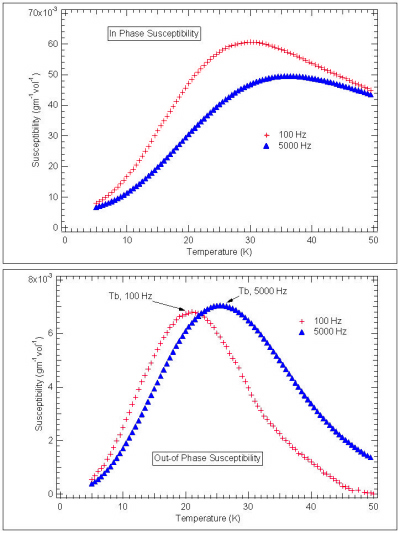
We use magnetic susceptibility to cleanly and carefully probe the relaxation of our
samples. The susceptibility measurement consists of applying a small oscillating field
across the sample and measuring both the strength of the induced signal and the phase
lag of this signal. A sample that relaxes quickly will have a small phase lag, and
material that is blocked from relaxing by an energy barrier will have a large phase
lag.
The picture is complicated somewhat by the fact that how much a material relaxes depends
upon how much time you spend looking at it. If a system has a decay time constant
of one second and you watch it for just a nanosecond it will look frozen, but if you
watch it for a minute you will observe it to relax considerably. To quantify this
we make measurements at several frequencies.
The relaxation time of single domain nanoparticles with uni-axial anisotropy is
![]()
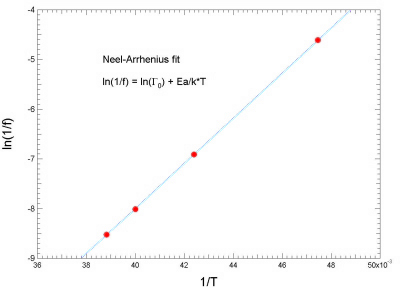
If we take the logarithm of this equation and make the substitutions T = Tb, the blocking temperature (see below), and t = 1/f, the measurement (or ‘watching’) time, then we find
![]()
The above equations are known as the Néel-Brown or Néel-Arrhenius equation. From plotting ln(1/f) versus 1/kBT we can extract the attempt frequency and the anisotropy energy, Ea.